Curve measurement
Some thoughts on the accumulated corona virus data.


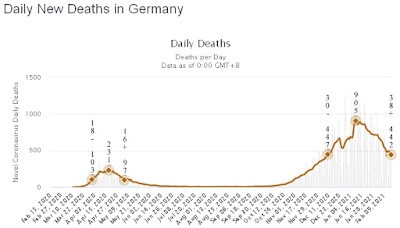

The time between the maximum deaths of a wave and half the deaths thereof is roughly 35 days for the Swedish waves, the first Dutch wave, the second German wave and the Indian wave. In case of the first Dutch and Swedish wave the increase is steeper, owing very likely to lacking testing for the corona virus in the beginning of the pandemic. And in the case of India the increase is less steep, owing very likely to developing immunity.
That time interval is roughly halved however for the first German wave and the second Dutch wave. The third Dutch wave is either long again, or it is short and a fourth wave is coming. The explanation for overlapping waves is that there are outbreaks in different places at different times. Interestingly this is not much of a factor in India, because if the Indian wave would be produced by several overlapping waves, it would be almost constant at its peak with relatively steep flanks.
The simplest explanation for different time intervals would be the presence of different viruses and I can't offer a better one based on the given data. India's death rate is of course very low. So it seems almost certain that the virus kills only during the cold season and hence conscious exposure during the warm season seems reasonable.
Labels: 29, mathematik, präsentation
Eingetragen Am/um
09:33
![]()